Cross validation for L2E trend filtering regression with distance penalization
CV_L2E_TF_dist.RdCV_L2E_TF_dist performs k-fold cross-validation for robust trend filtering regression under the L2 criterion with distance penalty
CV_L2E_TF_dist(
  y,
  X,
  beta0,
  tau0,
  D,
  kSeq,
  rhoSeq,
  nfolds = 5,
  seed = 1234,
  method = "median",
  max_iter = 100,
  tol = 1e-04,
  trace = TRUE
)
Arguments
| y | Response vector |
|---|---|
| X | Design matrix. Default is the identity matrix. |
| beta0 | Initial vector of regression coefficients, can be omitted |
| tau0 | Initial precision estimate, can be omitted |
| D | The fusion matrix |
| kSeq | A sequence of tuning parameter k, the number of nonzero entries in Dbeta |
| rhoSeq | A sequence of tuning parameter rho, can be omitted |
| nfolds | The number of cross-validation folds. Default is 5. |
| seed | Users can set the seed of the random number generator to obtain reproducible results. |
| method | Median or mean to calculate the objective value |
| max_iter | Maximum number of iterations |
| tol | Relative tolerance |
| trace | Whether to trace the progress of the cross-validation |
Value
Returns a list object containing the mean and standard error of the cross-validation error -- CVE and CVSE -- for each value of k (vectors), the index of the k value with the minimum CVE and the k value itself (scalars), the index of the k value with the 1SE CVE and the k value itself (scalars), the sequence of rho and k used in the regression (vectors), and a vector listing which fold each element of y was assigned to
Examples
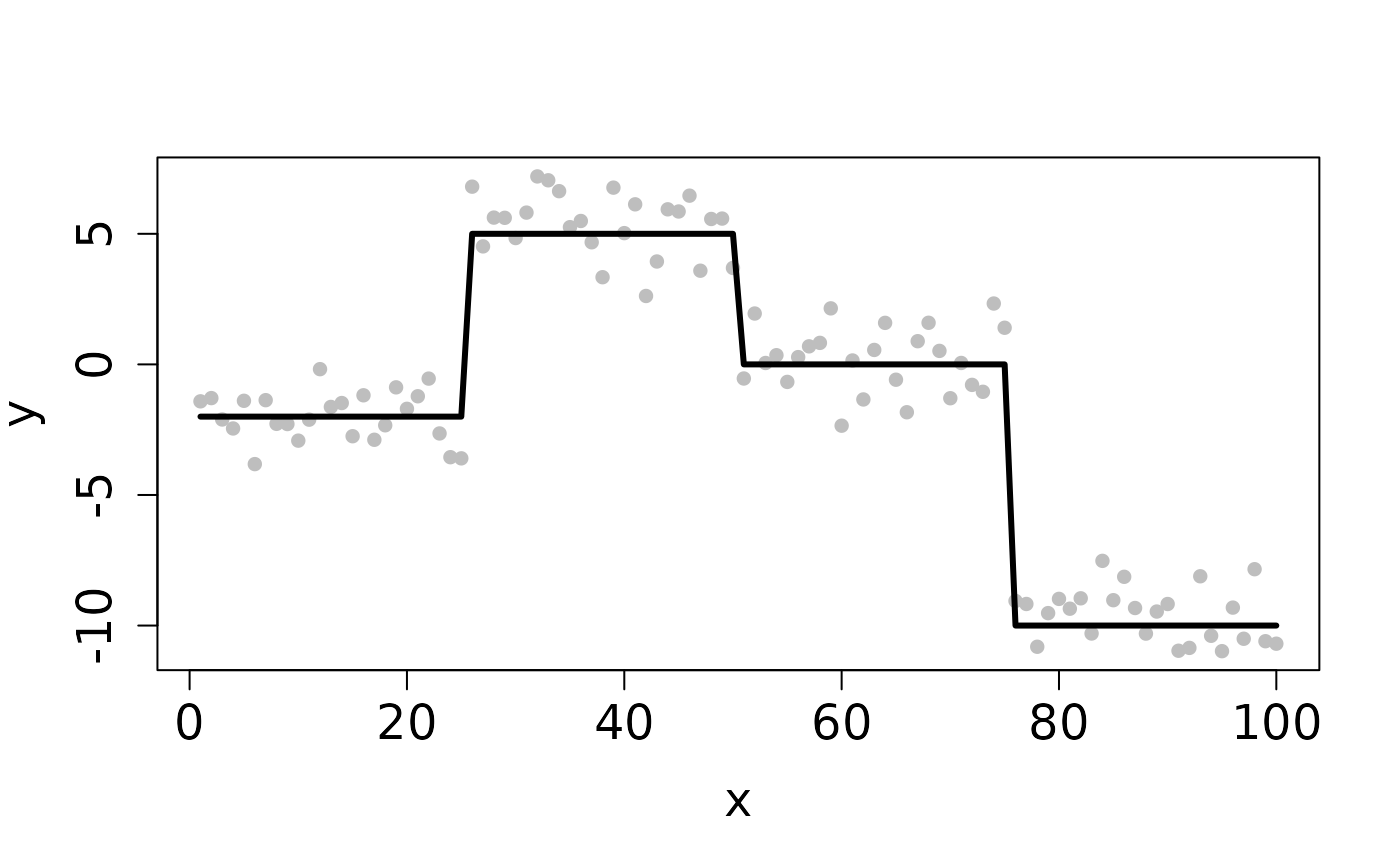
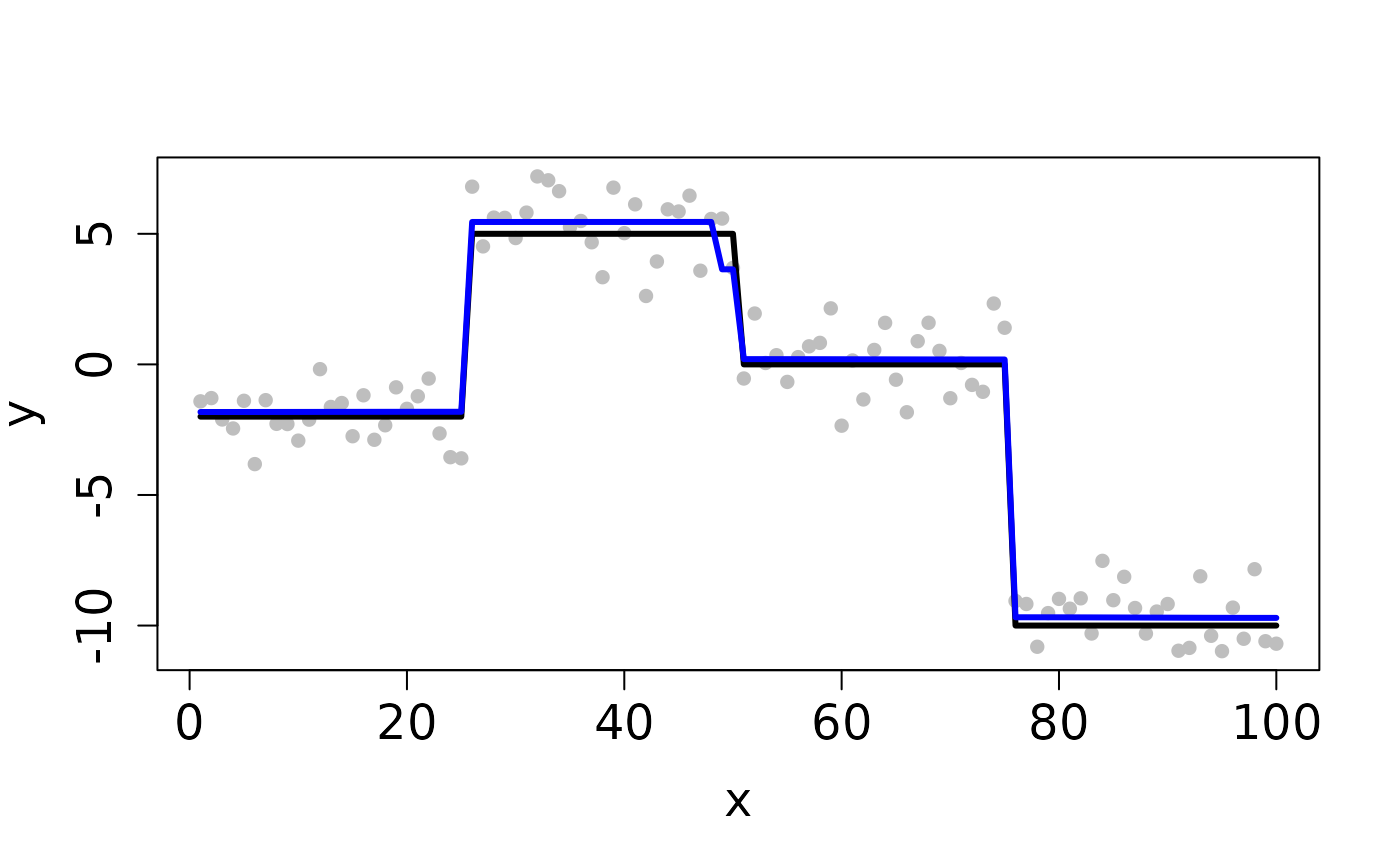
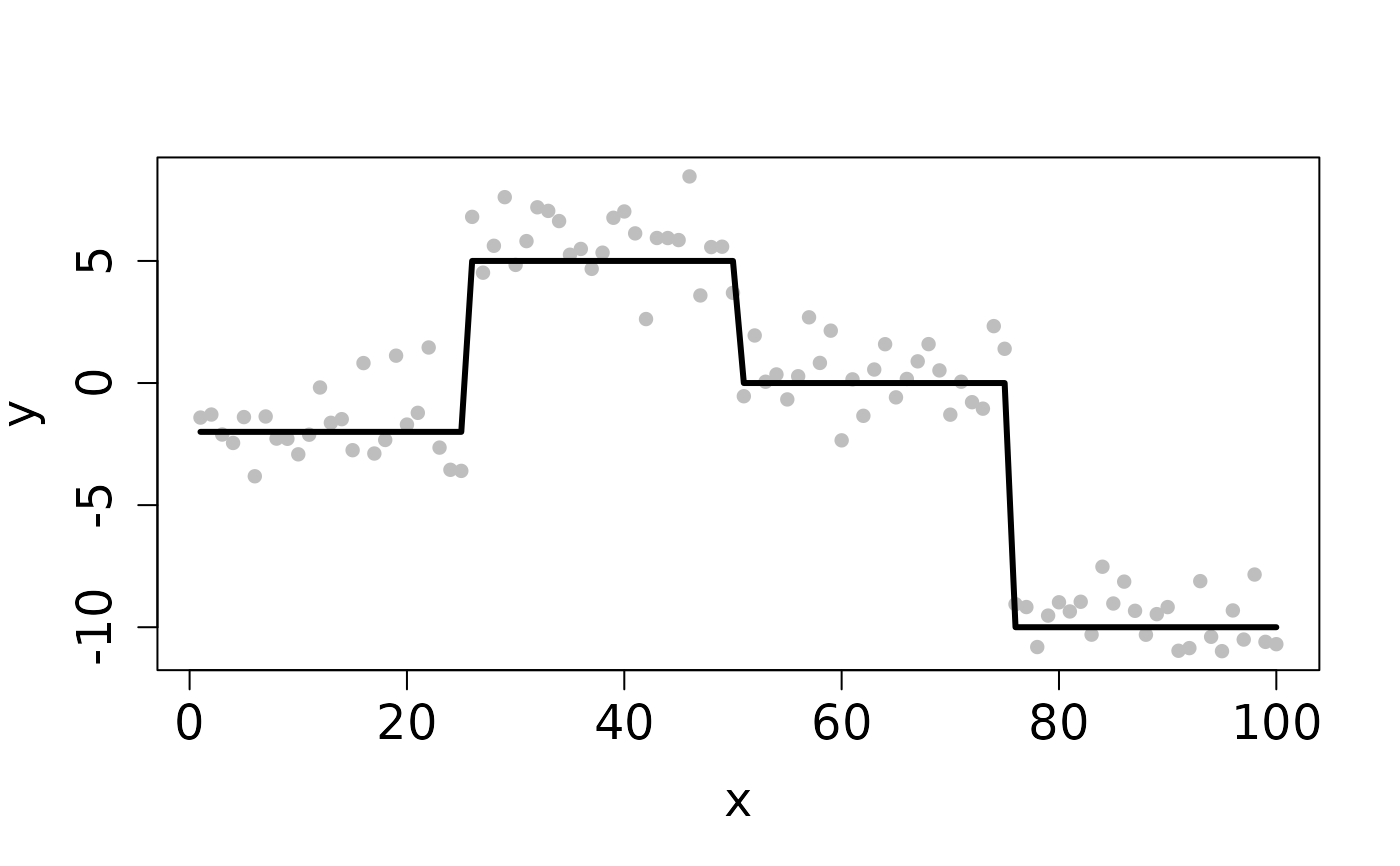
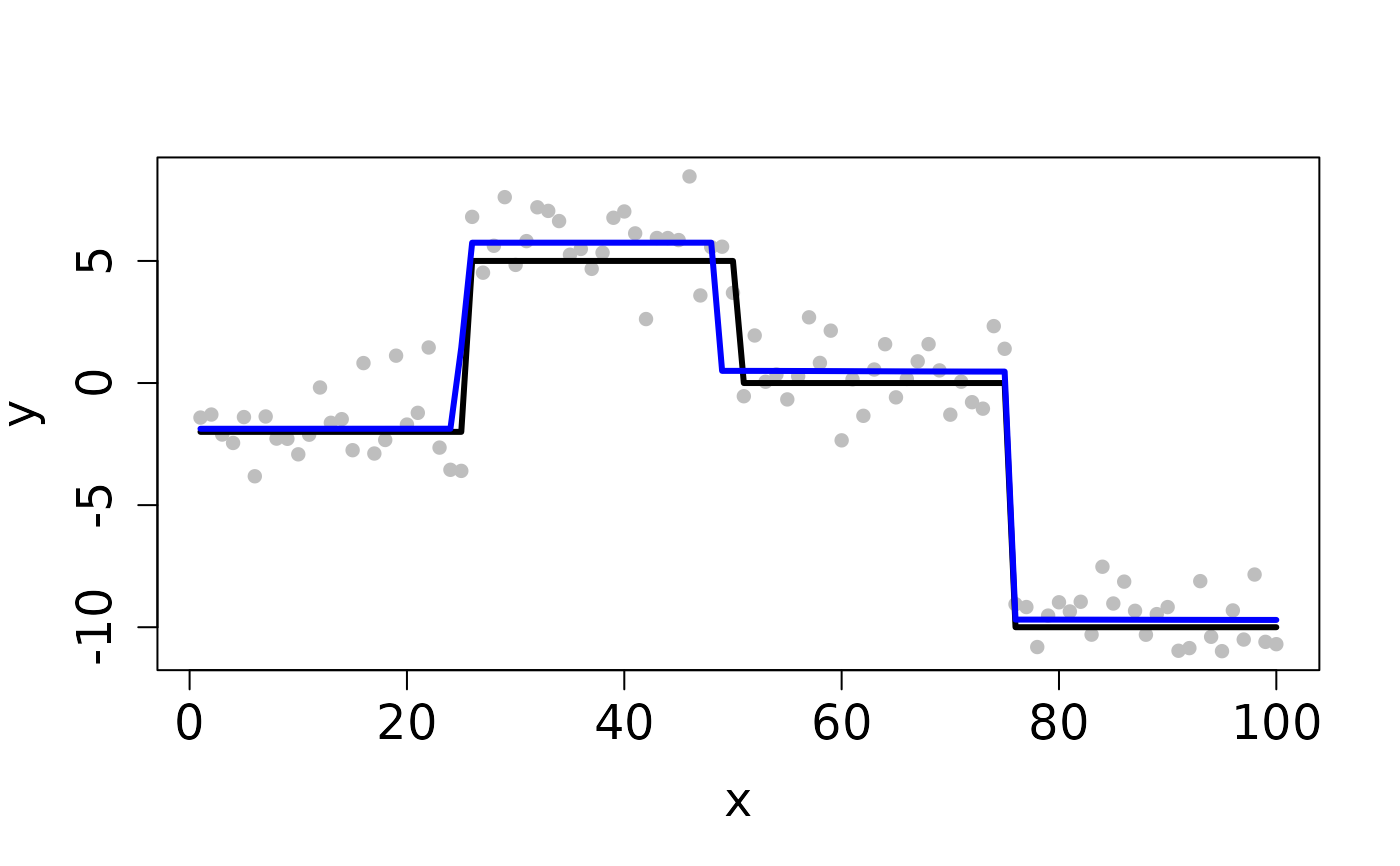
## Completes in 20 seconds set.seed(12345) n <- 100 x <- 1:n f <- matrix(rep(c(-2,5,0,-10), each=n/4), ncol=1) y <- y0 <- f + rnorm(length(f)) ## Clean Data plot(x, y, pch=16, cex.lab=1.5, cex.axis=1.5, cex.sub=1.5, col='gray')D <- myGetDkn(1, n) k <- c(4,3,2) rho <- 10^8 cv <- CV_L2E_TF_dist(y=y0, D=D, kSeq=k, rhoSeq=rho, nfolds=2, seed=1234)#> Starting CV fold #1 #> Starting CV fold #2(k_min <- cv$k.min)#> [1] 4#> user system elapsed #> 0.843 0.000 0.843## Contaminated Data ix <- sample(1:n, 10) y[ix] <- y0[ix] + 2 plot(x, y, pch=16, cex.lab=1.5, cex.axis=1.5, cex.sub=1.5, col='gray')cv <- CV_L2E_TF_dist(y=y, D=D, kSeq=k, rhoSeq=rho, nfolds=2, seed=1234)#> Starting CV fold #1 #> Starting CV fold #2(k_min <- cv$k.min)#> [1] 4#> user system elapsed #> 0.976 0.000 0.977